Recap for 12/1/2022 – BBAI (edited)
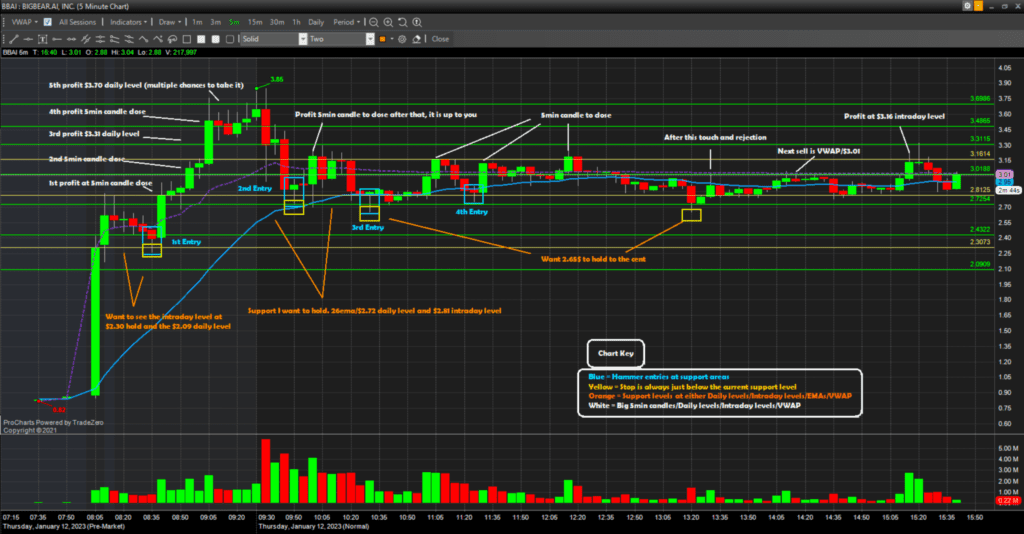
[3:57 PM]Dae: Indicators Dashed purple line = VWAP / Pink line = 5ema / White line = 12ema / Blue line = 26ema / Yellow line = 50ema / Teal line = 89ema / Orange line = 200ema / Volume Support and Resistance levels Green horizontal solid lines are either daily or hourly levels Yellow horizontal lines are intraday levels, which i find using big stick 5min candles White horizontal lines are Pre-market high and Pre-market low (edited) 3
3