Thank you Dae for taking the time to teach us! God Bless you!
What follows is a copy of Dae’s explanations of his trades for the day.
Dae recap for ATNF
4:07 PM Dae Indicators
Dashed purple line = VWAP / Pink line = 8ema / White line = 12ema / Blue line = 26ema/Yellow line = 50ema/ Teal line =89ema / Orange line =200ema / Volume
Support and Resistance levels
Horizontal solid purple lines are either daily or hourly levels Yellow horizontal lines are intraday levels, which i find using big stick 5min candles (edited)
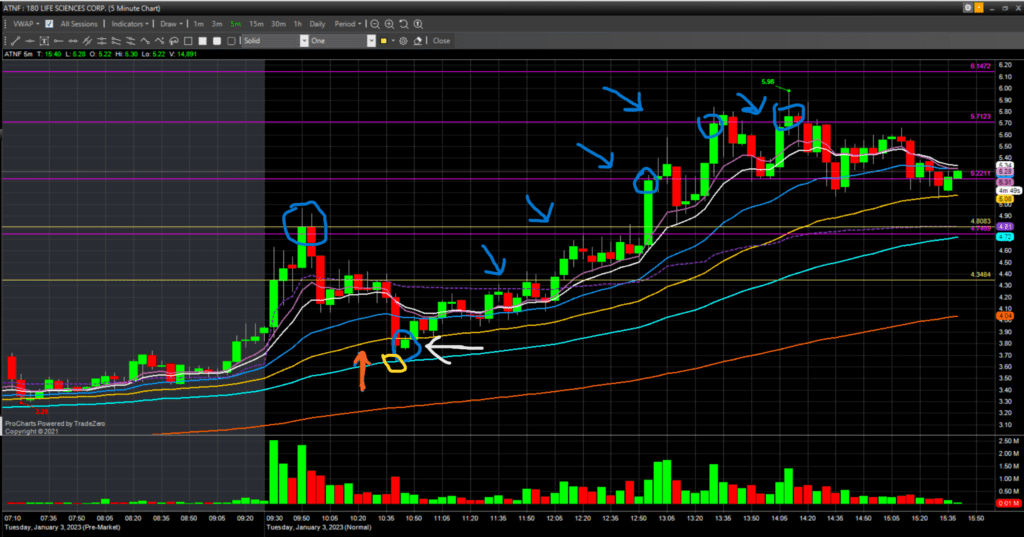
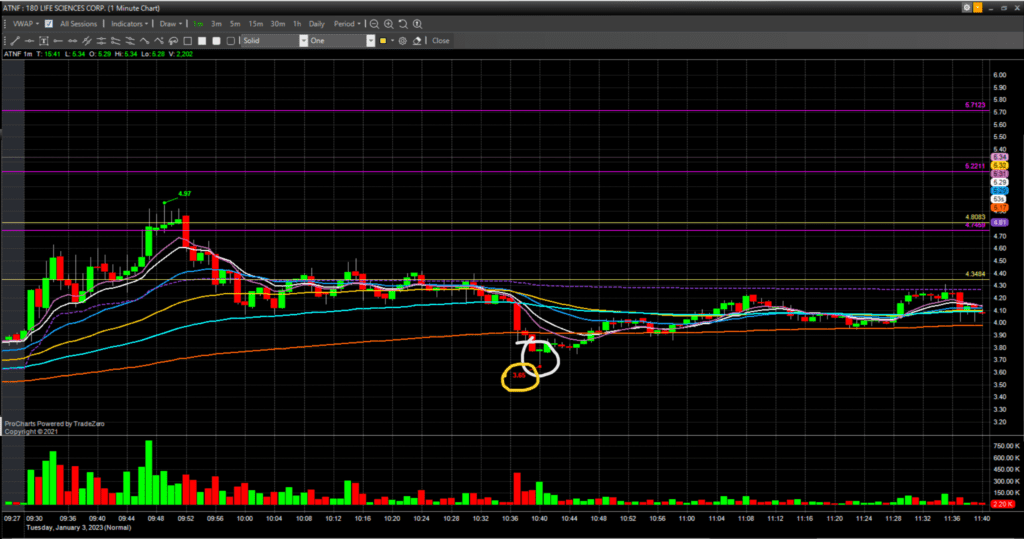
This entry is simple, it’s a strong hammer after a sell off, which is showing on the 2nd chart with the white circle, the yellow circle is what the stop would be, very simple
The first chart shows what it would look like on the 5min and if you wanted to be careful, you’d wait for that inverted hammer to form, after that it opens on the 50ema which the orange arrow is pointing to (and along with 200ema is a very strong area imo)
I personally sell at daily or intraday levels, each blue arrow shows a sell point and you can see it fits nicely a few times with big stick 5min candles which i also like to sell on
The last blue circle shows a shooting star (which is bearish) at a level that has already been tested
For me this is a clear double top and would be an easy sell
That trade, if taken on the 1min level, would give you $1.39 per share profit
Dae Recap for 3/1/2022 CMMB
Indicators
Dashed purple line = VWAP/Pink line = 8ema/White line = 12ema/Blue line =26ema/Yellow line = 50ema/Teal line=89ema/ Orange line=200ema/Volume
Support and Resistance levels
Horizontal solid purple lines are either daily or hourly levels. Yellow horizontal lines are intraday levels, which i find using big stick 5min candles
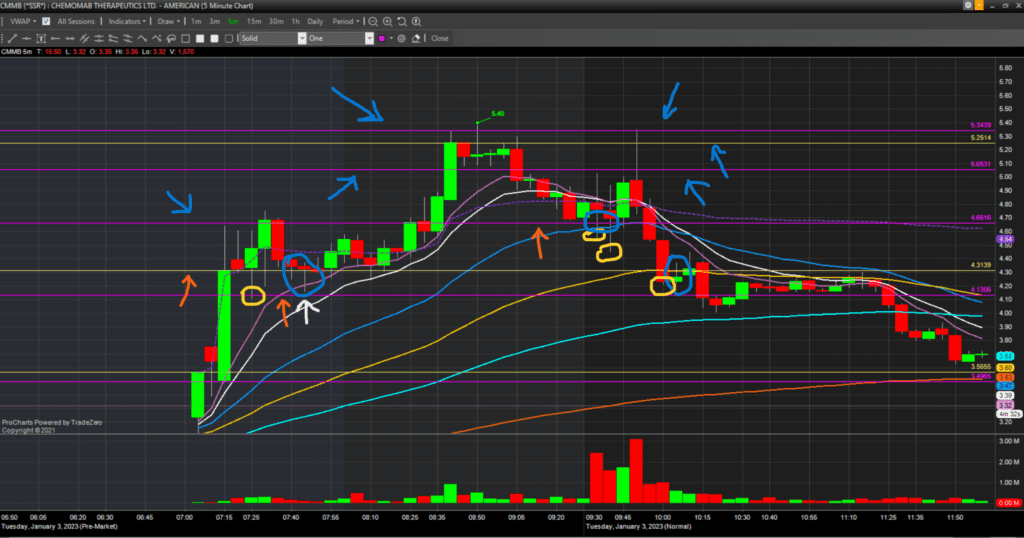
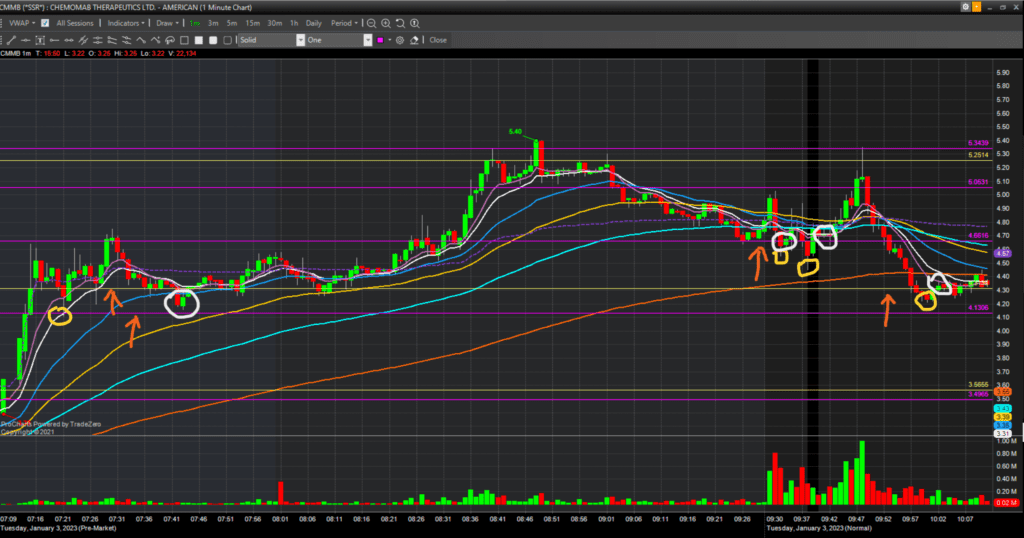
First trade Entry- From the first chart, this was based off the daily level and the intraday level being respected, which the orange arrows show, anything between that is a demand area for me and you can see on the 1min chart, the price dropped into it, and formed a bullish engulfer, that is a buy signal
Dae Stop 1-Stop is the bottom of the wick of the lowest candle which is circled in yellow
Dae Profit 1-Profits are each blue arrow based on daily levels, you have another shooting star at the top of the chart signalling another area to sell
Dae Second trade Entry-Second entry was at the bell, it was a bit messier but you can see the orange arrow pointing area of resistance pre-market, but also a daily
Dae on the 1min chart you have an inverted hammer around that level, you can add that and set the stop at the bottom of the wick at the lowest candle
Dae now this is where you don’t stop out and walk away, because on this trade, you will stop out, but if you carry on watching, it sets up 2mins later
Dae you can add at that 4.66 level
Dae Stop 2-Stop below the wick of the lowest candle again (this is a bit more risk than would usually like, but the risk versus reward is good here)
Dae Profit 2-I would have 3/4 profit levels here, 1st is the big stick 5min candle, then the 2 daily levels and the intraday level
Dae Once profit has been taken, i almost always have a stop at entry
Dae let me know if this was helpful with a thumbs up and let me know in chat if this is too messy with EMAs etc..
Dae Third trade Entry, was a hammer an inverted hammer from that same demand zone Dae Stop 3-is the yellow circle, at the lowest wick again
Dae Profit 3-No profit, it was a stop out trade, but could of been nice risk versus reward up to VWAP/4.66 level from 4.31
Dae If i followed my rules, profit from trade 1 = 80c trade 2 = 51c trade 3=-10c