Taken directly from a Twitter thread of
The largest issue from what I’ve seen for new traders is determining where to enter trades. Most traders get caught chasing or adding in poor areas and then sell for losses. Here’s a thread on some areas where you can enter trades for minimal risk and maximum reward:
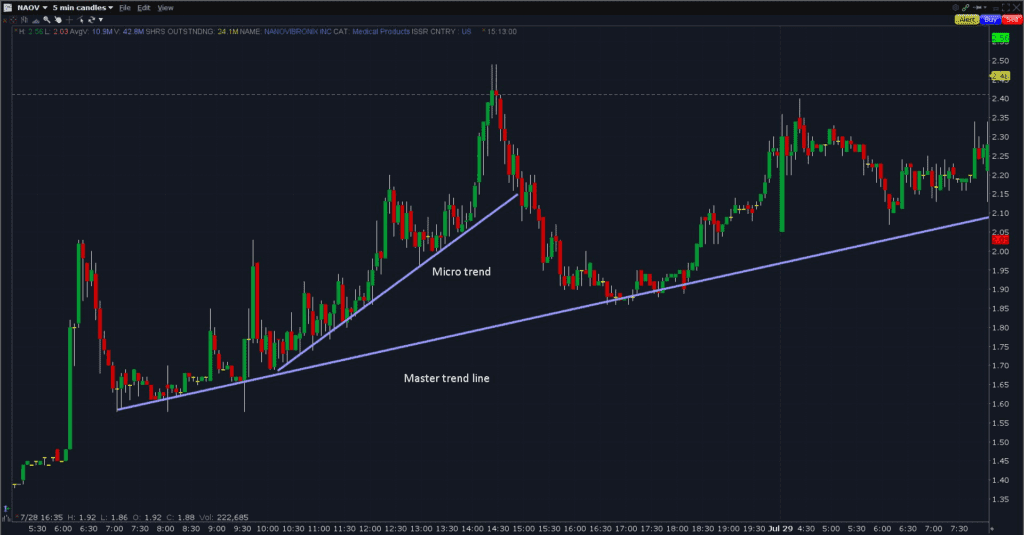
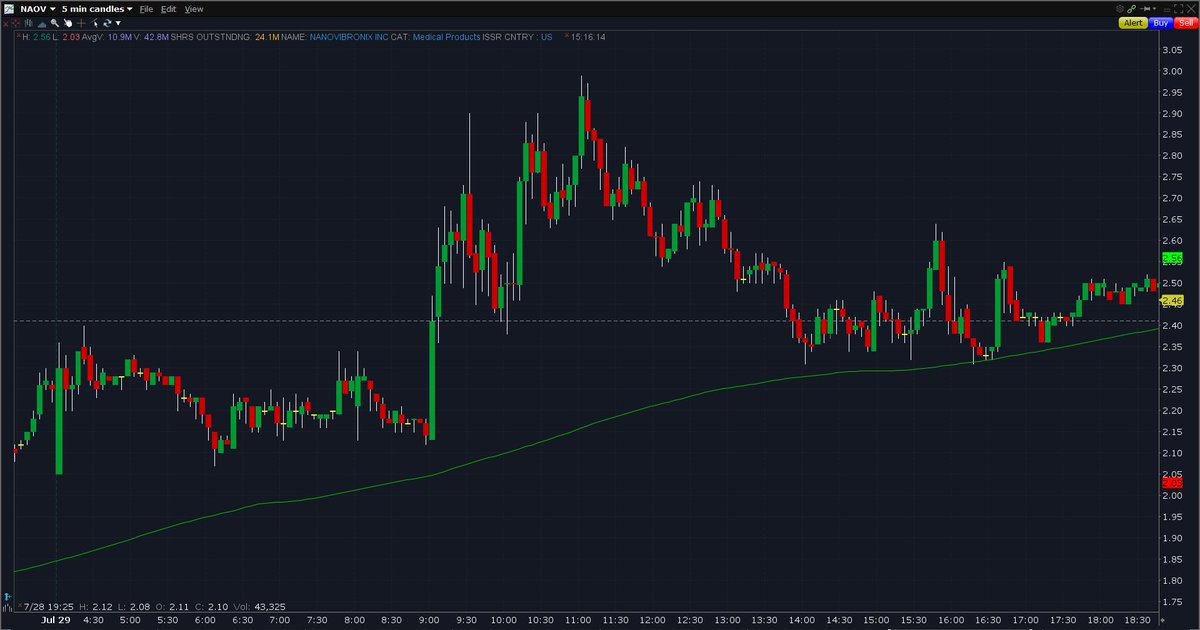
1. Master trend lines and micro Enter on confirmation of the master trendline holding with a stop-loss a few cents below the prior wick lows to ensure you don’t get wicked out. You can also build smaller micro-trends inside and use those with similar risk/reward. $XBIO $NAOV

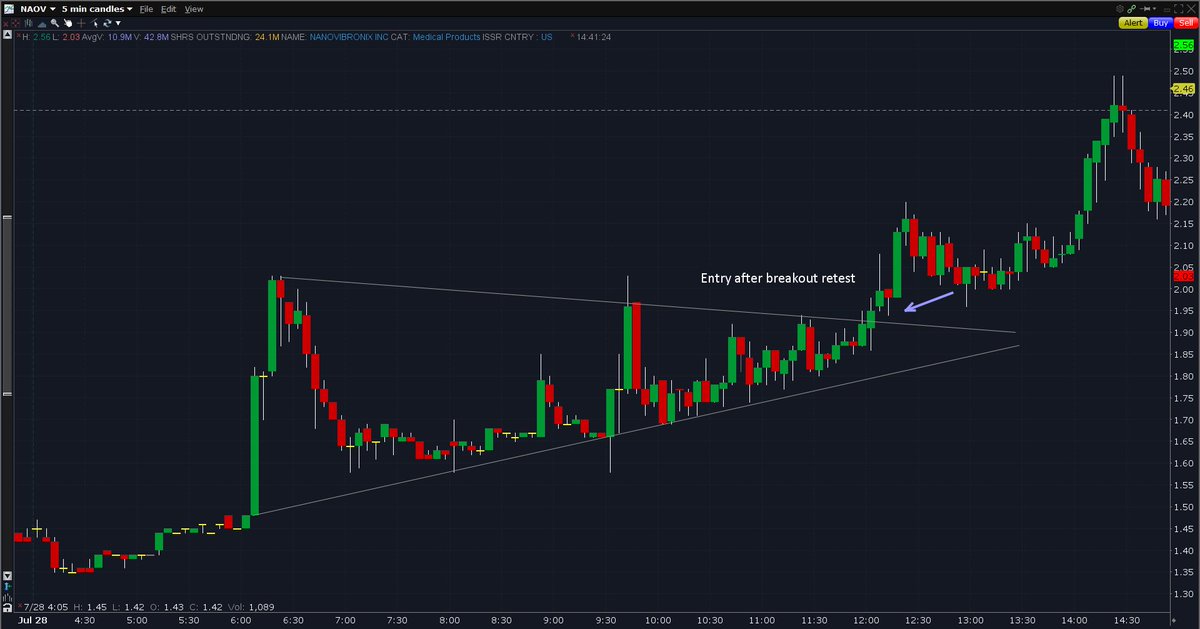
2. Pattern breakout retests There are tons of great patterns you can use retests for confirmation with: flags, descending wedges, ascending triangles, etc. Learn and utilize them $NAOV
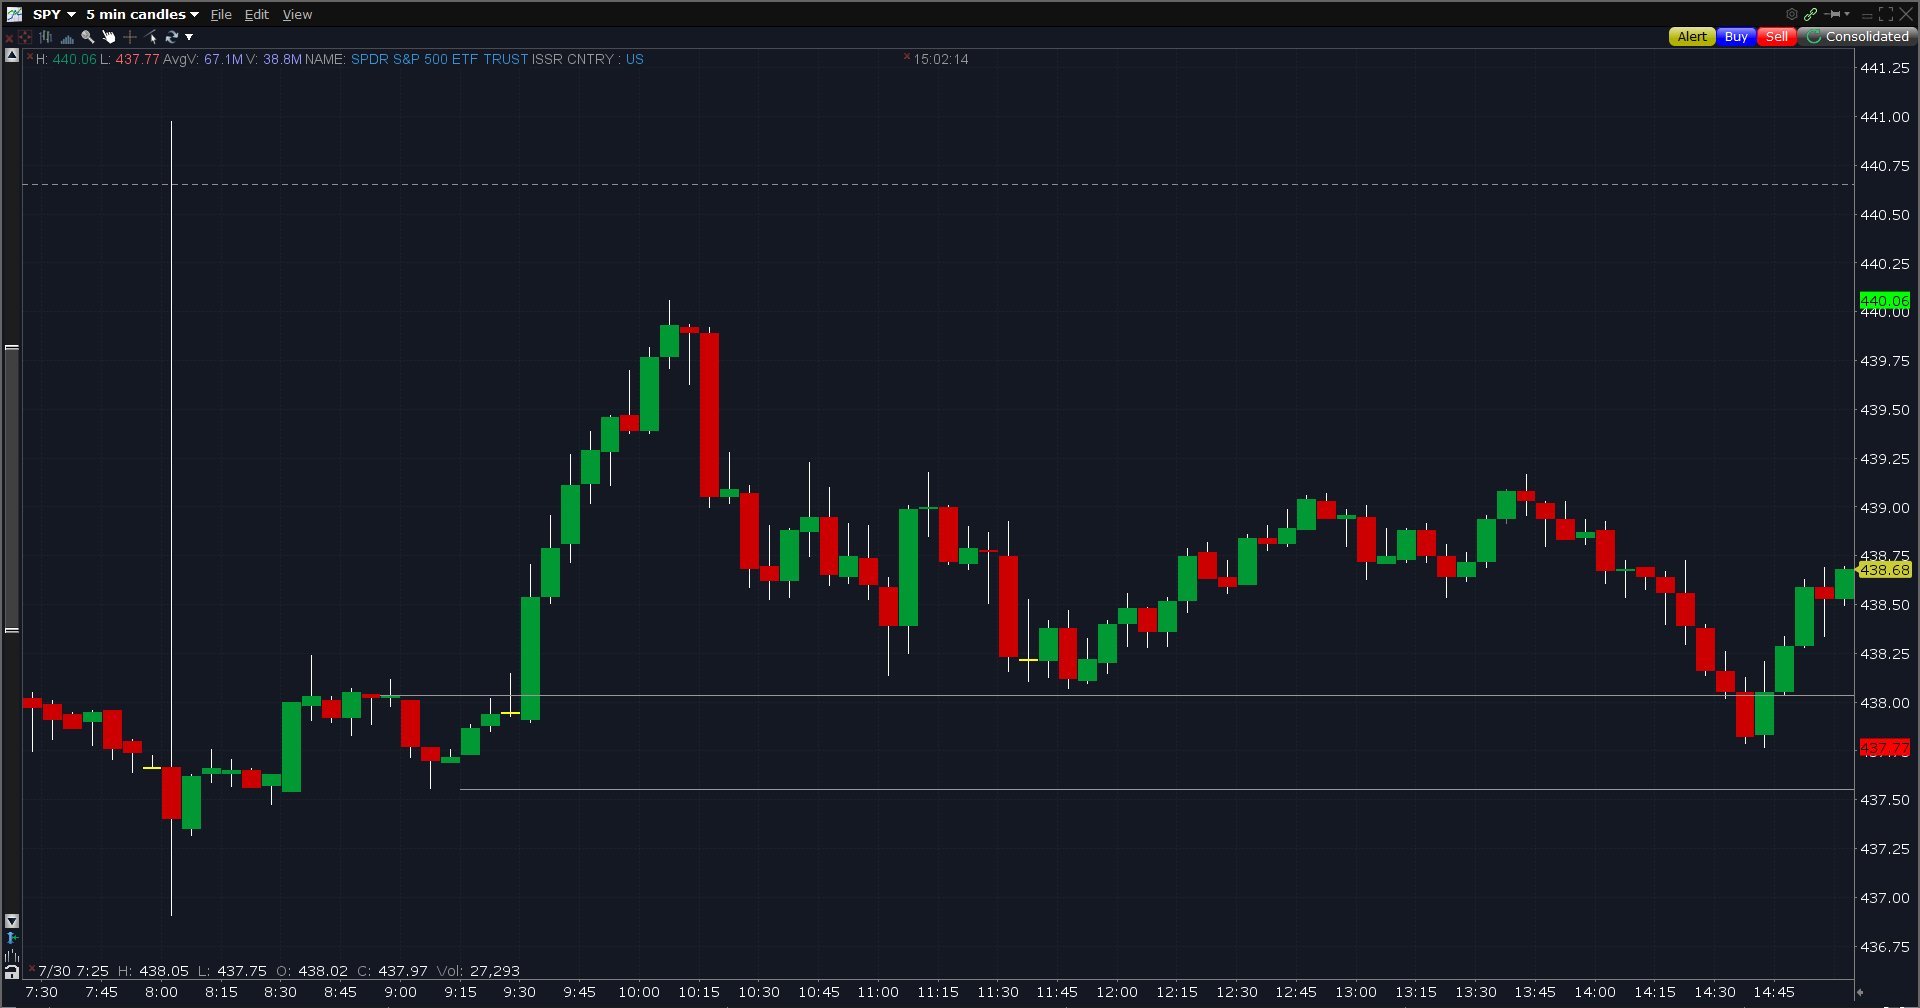
3. Supply and Demand zones. Enter with bids inside the zone or after a hammer formation indicating buying is present and the zone is being respected. Note, larger time frames are better (4h, 2h, 1h, etc), but you can use smaller intraday too. $XBIO $SPY

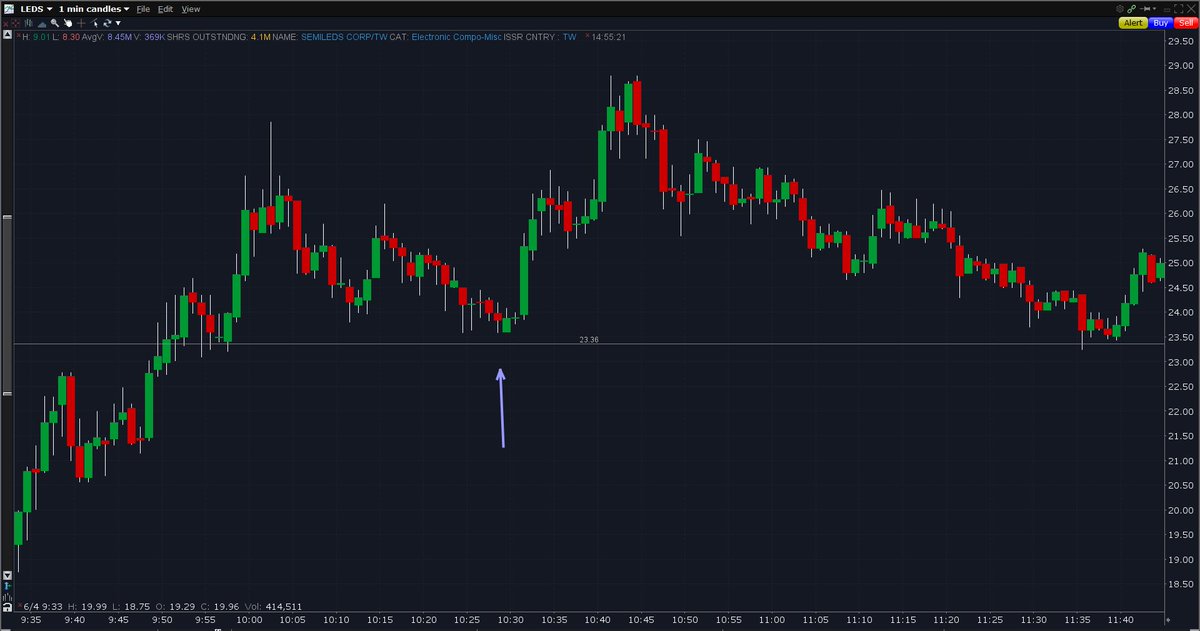
5. Low volume pullbacks after a rally These usually lead to a pop. To secure downside, place your stop loss accordingly with support/resistances in mind while also accounting for wicks $LEDS
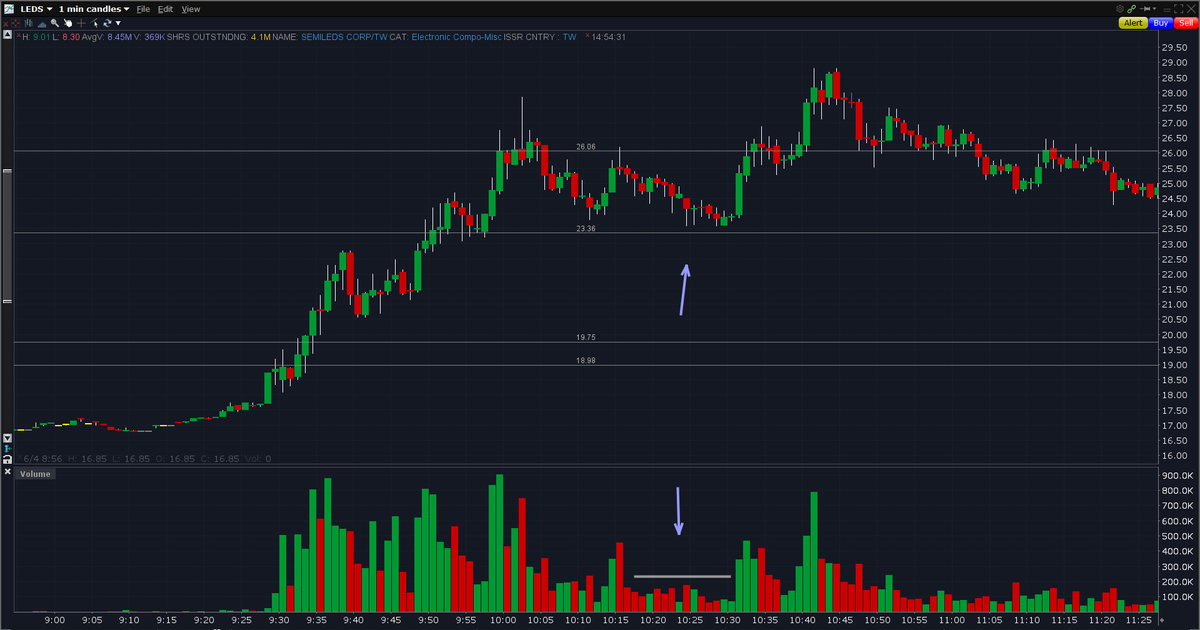
6. Daily / 4 hour support levels. These are the two best time frames for support/resistances. Move down in time frames as needed with stocks that don’t have as much recent data $LEDS
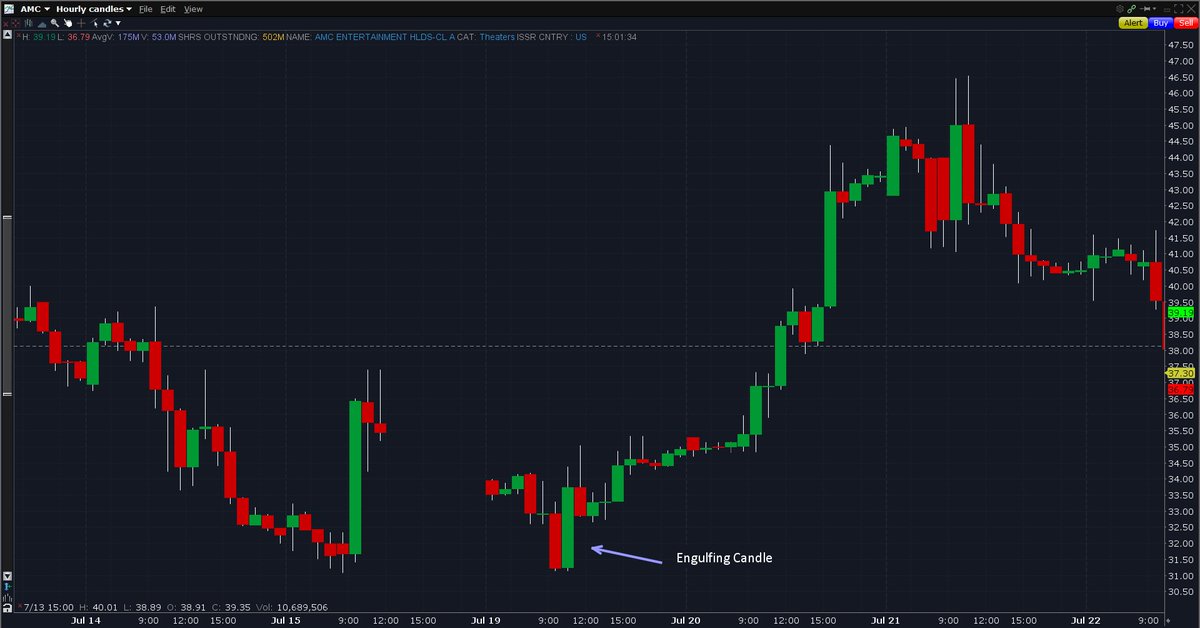
7. Bullish candlestick patterns This one in particular is your bullish engulfing one, but you should look into and learn others: Hammer candle, morning star, three white soldiers, etc. The larger the time frame, the better $AMC
8. Technical indicators strategies (if you have an effective method) I use the 9/20 EMA, so I’ll add on a 9 ema pullback (blue) with risk below the 20 (purple), or I’ll add on the 20 with risk just below it. You can use various time frames and carry the rules $NAOV
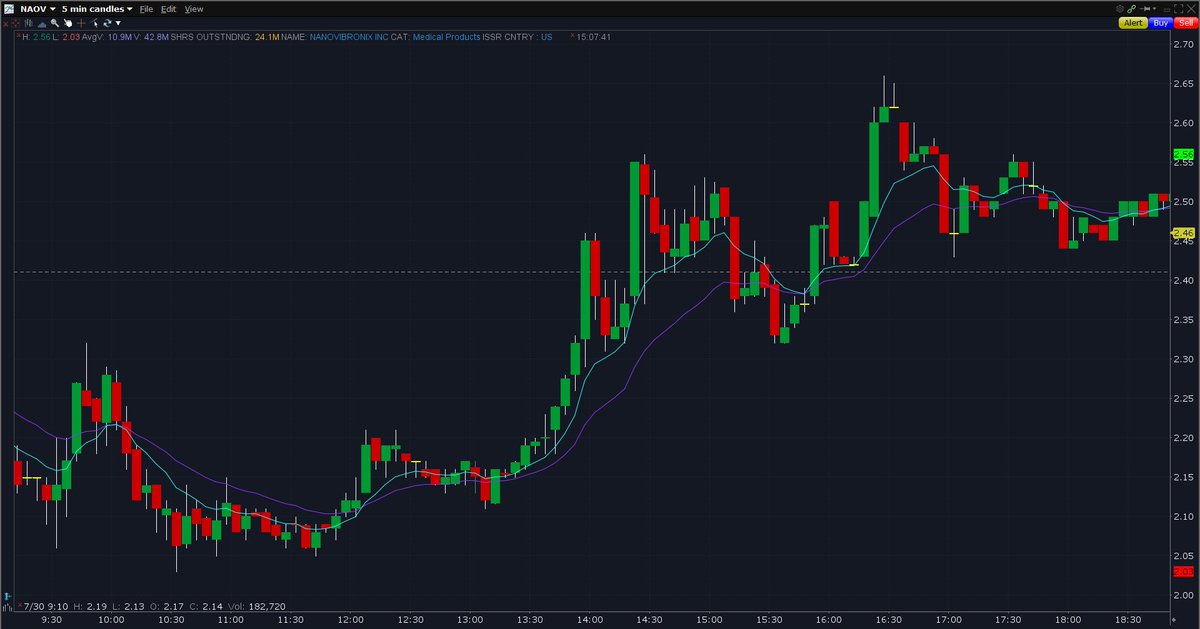
8. (continued) 50 SMA (white) is a great support add and so can the 200 SMA (green) be. The larger the time frame, the better $NAOV

This is one video I really like for patterns, but there are plenty more than this:
Charting refers to technical analysis that is performed through careful inspection of share price data for identification of well known patterns that emerge …
There’s tons of other great candlestick formations & trend patterns that can be used to enter trades. Take the time to learn them and utilize them instead of slapping anything that spikes. Defining your risk/reward before every trade is how you’ll succeed in this game